|
||||||
 |
|
|||||
|
||||||
|
|
|||||
|
#1
 06-27-2017, 12:10 PM
|
|||
|
|||
|
For 1952 Topps gray backs, I have been wondering how rare the "white front" cards are relative to the "gray front". I have always heard "about 10%". I thought I would explore the proposition.
For over 12 years I have been cataloguing 1952 Topps gray backs by PSA or SGC flip number, thereby creating a database of unique identifiers. I have created the database from E-bay sales, AH sales, VCP website, registry sets with photos, etc. A few weeks ago there were 1054 graded Topps and 122 graded SGC cards, total of 1176 graded 1952 T gray backs. I have uniquely identified 730, or 62 percent. (There is surely some error as cards are broken out and re-submitted, etc., but I am hoping that in general the numbers apply.) The result: 82 "white front" and 648 "gray front". 11%, or 1 in 9 are white. (I also realize that determining color from scans is often an art and not a science, but I am fairly confident in the results.) This clearly assumes that the raw cards out there are in the same proportion. I have obviously seen many raw scans, but there is no way to consistently uniquely identify them to prevent double-counting. So, "about 10%" seems a great rule-of-thumb. BTW, the are 14 cards for which I have never identified a white front version: Widmar, Howell, Hartung, Haynes, Klippstein, Post, Smalley, Marshall, Edwards, Smith, Maxwell, Masterson, Miller, and OF COURSE, Reiser. I will continue research, but I figured at my age I better make public what I have or it may be lost forever. Hopefully the sample size justifies the conclusions. Not sure if anyone is interested in this post, but if so, I welcome comments. And I certainly welcome scans of any privately held cards that would expand the data base. Bill 
|
|
#2
06-27-2017, 12:16 PM
|
|||
|
|||
|
Bill-- I appreciate the info . Good of you to share it. I think you may have done it elsewhere but would appreciate a scan of both front versions of one of the gray backs side by side if you can do that
|
|
#3
06-27-2017, 02:51 PM
|
|||
|
|||
|
Bill,
Are you saying the mid-series "white front" gray back cards are the same as the mid-series gray back glossies? I know the mid-series glossies have been referenced several times on N54 - but no one to date (except maybe Scott and or Ted S) has much experience with these. And no one that I am aware of has ever figured out how common these are in relation to the normal mid-series gray backs. If this is the case, congrats (!) & great information. I have perhaps 23 mid-series gray backs, but don't think I have any glossies. Unsure if they have white fronts. I am travelling currently and will have to check when I return. Z
|
|
#4
06-27-2017, 05:13 PM
|
|||
|
|||
|
One of the first references I have found pertaining to the mid-series "white front" & gray back glossies came from SCD in their discussion with John Rumierz on refuting their Canadian origin. John was collecting '52 Topps back in the '70's & noted the difference between normal gray backs & the ones with glossy fronts.
The link follows - see item #6, half way down: http://www.sportscollectorsdigest.com/topps_canadian/ Z
|
|
#5
06-27-2017, 06:05 PM
|
||||
|
||||
|
Quote:
Thank you! 
__________________
52 Topps cards. https://www.flickr.com/photos/144160280@N05/ http://www.net54baseball.com/album.php?albumid=922
|
|
#6
06-27-2017, 06:27 PM
|
|||
|
|||
|
Quote:
I do not have immediate access to my cards. But perhaps others on this site can give you a scan comparison. Also, if you go to the PSA registry 1952 Topps Super Set, you will see some photos of both variations. For example, Morrison's set. Bill
|
|
#7
06-27-2017, 06:35 PM
|
|||
|
|||
|
Quote:
All "glossies" are white front. Not all white front are glossies. No gray front is glossy. I don't know if there are two variations of the white front or not. (Lordy, I hope not!) The non-glossy white front could be non-glossy because of wear. Keep in mind that the cards I am talking about here are ones that I have seen 'live"--a much smaller subset than my original data base. It is impossible for me to tell glossiness in a scan. Bill
|
|
#9
06-29-2017, 12:20 PM
|
|||
|
|||
|
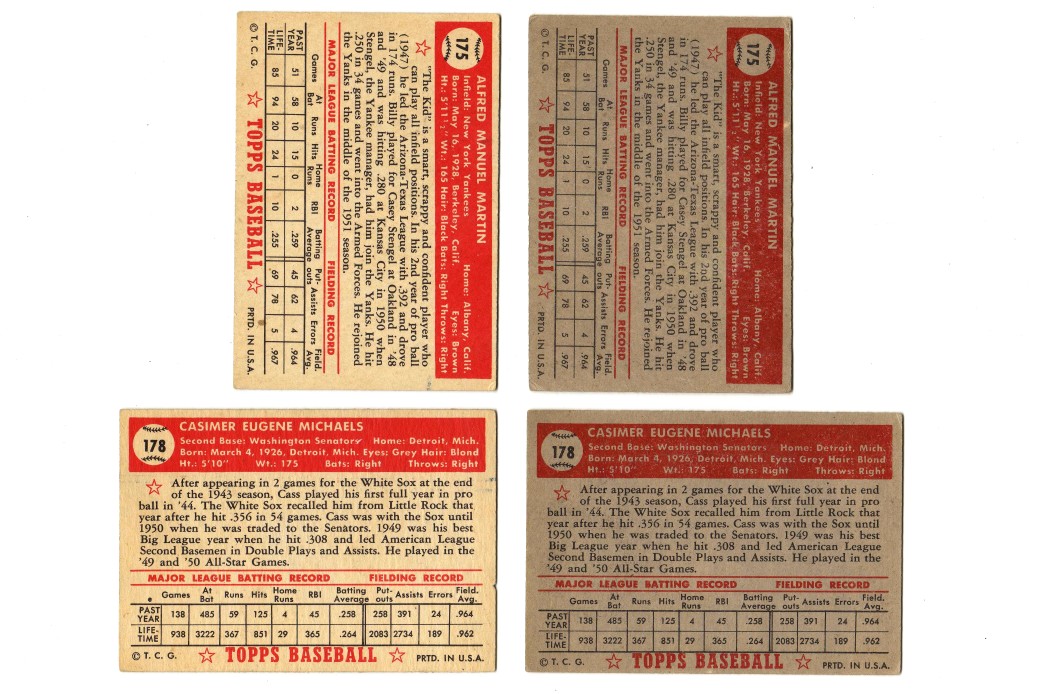
Al,
Here are 2...the #144 Blake is a glossy white front / gray back and #145 is the normal gray front / gray back. Differences are subtle and color differences could be an artifact of scanning. These were taken from the 1952 Topps Super Set for Harrison in the PSA Registry section. Thanks Bill for pointing this out. Z
|
|
#10
06-29-2017, 12:51 PM
|
|||
|
|||
|
They do look different, thanks Zach
|
|
#11
06-30-2017, 01:03 PM
|
|||
|
|||
|
Bill,
According to G Vrecheck in this link: http://www.pjdenterprises.com/baseba...pps_print.html the 3rd series was printed such that the 1st 40 cards (#131-170) were double printed while the remaining 20 cards (#171-190) were single printed. This seems to follow with the commonly accepted mid-series scarcity for gray backs. Did you notice the same quantity in glossies i.e did they follow this same pattern? Z
|
|
#12
07-01-2017, 12:20 PM
|
|||
|
|||
|
Great question! The answer appears to be "yes." The ratio of GB/WF to all GB for the first 40 cards is 11.8%. The same ratio for the last 20 cards is 11.2% (well within the accuracy of the data). So I would propose that the white front have a uniform scarcity throughout the 60 cards--about 1 in 9.
But your question took me down a couple of other rabbit holes and kept me up until the wee hours this morning. I will compose two more responses. The first will cover my take on the distribution of cards with the subset (relative scarcity) and the second will cover relative scarcity of the GBs and GB/WFs when compared to the CBs. ALERT--52 T GRAY GEEKS ONLY! Bill
|
|
#13
07-01-2017, 12:39 PM
|
|||
|
|||
|
Quote:
Alternatively, about 18 months ago, Patrick proposed the following: "Here is the layout: 3rd series: 131 132 133 134 135 136 137 138 139 140 131 132 133 134 135 136 137 138 139 140 141 142 143 144 145 146 147 148 149 150 141 142 143 144 145 146 147 148 149 150 151 152 153 154 155 156 157 158 159 160 151 152 153 154 155 156 157 158 159 160 161 162 163 164 165 166 167 168 169 170 161 162 163 164 165 166 167 168 169 170 171 172 173 174 175 176 177 178 179 180 171 172 173 174 175 176 177 178 179 180 181 182 183 184 185 186 187 188 189 190 181 182 183 184 185 186 187 188 189 190 131 132 133 134 135 136 137 138 139 140 131 132 133 134 135 136 137 138 139 140 141 142 143 144 145 146 147 148 149 150 141 142 143 144 145 146 147 148 149 150 151 152 153 154 155 156 157 158 159 160 151 152 153 154 155 156 157 158 159 160 161 162 163 164 165 166 167 168 169 170 161 162 163 164 165 166 167 168 169 170 Patrick" This assumes the same 200-card run, but has a different scarcity ratio. Quadruple prints of the first 40 (160) and double prints of the last 20 (40), or a ratio of 2:1. What do the data say? If you look at the pop report from PSA for CB 3rd series, you get the following average pops: 131-140 483 141-150 489 151-160 487 161-170 492 171-180 467 181-190 390. The average for 171-180 is probably inflated by about 1000 pop for Martin. If you back out the Martin, you get an average of 410 for those cards. The data would seem to suggest that there is a clear break in scarcity between the first 40 and the last 20. The conundrum is that the ratio is about 1.2 between the first forty and the last 20, and not 2.0, as Patrick's scheme would suggest. I welcome any thoughts. Bill
|
|
#14
07-01-2017, 01:11 PM
|
|||
|
|||
|
For those who are still interested, here is my third post in response to Zach. The final rabbit hole I explored is the relative scarcity of GBs and GB/WFs compared to CBs.
Comparing the average pop of CB and GB in the PSA pop report reveals the following: 28,179 CBs and 1055 GBs--a ratio of 1 GB for every 27 CBs. I surmise that this is probably conservative; i.e. collectors are more likely to send in a VG GB Kluttz that a VG CB Kluttz, resulting in a relative over-reporting of GBs. From this point on, you can make you own assumption about the relative over-reporting of GBs. So I made the assumption that the pops of Billy Martin may be more representative of the printed universe of 3rd Series. That is, collectors MAY BE just as likely to send in a VG CB Martin as a VG GB Martin. (I welcome other thoughts about this assumption.) Martin CB-959 pop Martin GB-19 pop A ratio of about 50:1. One GB for every 50 CBs. And from my original post, 1 GB/WF for every 9 GBs So, my tentative hypothesis: For every 500 3rd series CB, there are 9 GBs, and 1 GB/WF. That's it. As always, I welcome feedback. Bill PS. If you think I am still too conservative, make your own assumption. Are GBs twice as scare as I postulate? Then for every 1000 CBs, there are 9 GBS, and 1 GB/WF.
|
|
#15
07-01-2017, 06:53 PM
|
|||
|
|||
|
Bill,
Interesting. Actually I was wondering if the 131-170 and 171-190 groupings follow the 80%/20% distribution posited by others. If your data is without bias, your data suggests a distribution of 69% / 31%. Is your data random? Z Last edited by Zach Wheat; 07-02-2017 at 01:53 AM.
|
|
#17
07-03-2017, 10:49 AM
|
||||
|
||||
|
Quote:
I know very little about these gray backs, other than what I have read here, since joining back in Jan of 2016, and being a 52 Topps collector, I find this info very interesting.
__________________
52 Topps cards. https://www.flickr.com/photos/144160280@N05/ http://www.net54baseball.com/album.php?albumid=922 Last edited by irv; 07-03-2017 at 01:52 PM.
|
|
#18
07-03-2017, 11:28 AM
|
|||
|
|||
|
We will just have to keep ourselves amused Dale
|
|
#19
07-03-2017, 01:54 PM
|
||||
|
||||
|
Quote:
I guess I could look at some of my cards and pretend some are grey. 
__________________
52 Topps cards. https://www.flickr.com/photos/144160280@N05/ http://www.net54baseball.com/album.php?albumid=922
|
|
#20
07-03-2017, 02:18 PM
|
|||
|
|||
|
Sorry if I offended; I wasn't getting any comments, so I figured there was no interest and I would just answer the one who showed interest. No hidden message.
If my data are representative (a legitimate IF), then conventional wisdom about the print run could be in error. There are two premises in the current model Patrick suggested 18 months ago: 1) the cards are generally in numerical order and not randomly placed on the sheet, and 2) Two 100-card sheets constitute a full cycle, which is then repeated. Over enough data, this should lead to a 2:1 ratio and not the ~1.2 that the data show. Seems to me premise 1) is probably correct. Looks like the way Topps did it over several years and it makes sense. That leaves premise 2). Perhaps there is a third 100-card sheet as part of one printing unit. This third sheet could over-represent the last 20 cards and adjust the ratio downward from 2:1. Indeed three sheets could have 5 of each number. Since the data do show that there is a fall-off in population for 171-190, something else might be going on. Also, it is interesting to remember that the 20 lowest pop cards are NOT just the last 20, but also some numbers from the first 40, e.g. #161 Rogovin. All-in-all, I really don't know the answer, Zach. Maybe the cards are randomly placed on an unknown number of sheets, then repeated. And feel free to entertain yourselves--might be more productive.
|
|
#21
07-03-2017, 02:24 PM
|
||||
|
||||
|
Quote:
I would like to contribute to this thread if I had the knowledge but at this point it's like I am reading from a book gathering as much info as possible. There was a time or 2 when I thought I may have/own a gray back but that was quickly dismissed, unfortunately.
__________________
52 Topps cards. https://www.flickr.com/photos/144160280@N05/ http://www.net54baseball.com/album.php?albumid=922
|
|
#22
07-03-2017, 04:01 PM
|
|||
|
|||
|
Quote:
Also, the 5th series sps are 280-300, not the last row of 10! Why would the 3rd be different?
__________________
"Trolling Ebay right now" © Always looking for signed 1952 topps as well as variations and errors Last edited by Republicaninmass; 07-03-2017 at 04:02 PM.
|
|
#23
07-03-2017, 05:11 PM
|
|||
|
|||
|
One possible explanation for the difference in print ratios could be related to the initial crude design. It has been documented many times that Cy Berger created this set over his kitchen table, and some half sheets still in existence support this contention. Examples of sheets exist where the borders don't even match up...resulting in notoriously poor centering when the sheets were cut.
Taking this one step further - maybe some of their 3rd sheet mid-series production was never distributed due to poor centering. The only gray backs I seem to find are the ones that are off center 95/5! Z
|
|
#24
07-03-2017, 05:54 PM
|
|||
|
|||
|
Since you want people to respond and a Bill Wight card was posted I'll share my story. I had a Bill Wight in my collection and I knew it was different than the other one I had so I keep both didn't know at that time their were grey backs.
I'm in OBC and George Vrechek asked if anyone had a grey back Wight because someone needed it to finish their set. So I sent him a picture and said this? He said yes I believe I traded it to someone here before I was a member. Don't remember his name but he gave me four grey backs for it then I traded three to Patrick to get down to one again. Then three years ago I found one in Canada to get me up to two again. I will say I got both of my cards in Canada to stir that pot. One card is graded and this is my second one. Rick
|
|
#25
07-03-2017, 06:54 PM
|
|||
|
|||
|
Good story Rick
|
|
#26
07-03-2017, 07:38 PM
|
|||
|
|||
|
Also, the Frank House card has a yellow tiger version, as well as the normal orange tiger version However, I have yet to see a variation of the pale tiger similar to that found on the cream backs. It's been either one or the other, with the pale yellow being extremely rare.
__________________
"Trolling Ebay right now" © Always looking for signed 1952 topps as well as variations and errors
|
|
#27
07-03-2017, 09:45 PM
|
||||
|
||||
|
when I'm at a card show, and I have the time, I'll thumb through the '52 Topps cards and look for the rare gray backs. After many many tries, I found one at a show in "The Villages" (a retirement community in Central Florida). $5 bargain box pick up. I almost never sell cards, but this one I was going to sell. I had it graded, and after talking it over with Patrick, I put it on eBay auction (starting price of $300). To bad a bidding war didn't break out, cause the card only got one bid.
Larry
__________________
Member of OBC (Old Baseball Cards), the longest running on-line collecting club www.oldbaseball.com
|
|
#28
07-14-2017, 10:11 AM
|
|||
|
|||
|
it's been getting tougher and tougher to find Grays in the bargain bins! I havent been able to pick up any from a show in quite a while.
__________________
"Trolling Ebay right now" © Always looking for signed 1952 topps as well as variations and errors
|
|
#29
07-19-2017, 07:56 AM
|
|||
|
|||
|
Not meaning to digress from the intent of Bill's original post - but was more than 1 type of gray paper stock used? I've attached pics of the same card #270, a semi-high card, which appears to have been printed on 2 types of paper....both are gray.
Z
|
|
#30
03-24-2020, 12:34 PM
|
|||
|
|||
|
I have been wanting to update this research for awhile, but could not manage to find the time. Well, now I have found it! Plenty...of...time.
I now have almost three more years of data for my white front/gray front study of the 52 Topps third series gray backs. (I know my language is confusing, but I also know that you geeks get it.) See my original post almost three years ago for the parameters and assumptions. I now have 1336 uniquely-identified gray backs (I will avoid repeating "1952 Topps third series" each time, but you know that is what I mean). These cards have been catalogued by TPG number, or in the case of raw cards, ones that I have in hand and can uniquely identify. As with three years ago, I am sure there is some double counting because of cards being broken out of the holders and resubmitted, or sold as raw. As with three years ago, I hope the data skewing is minimal and does not affect the overall conclusion. My data now show that about 15%, or about 1 in 7 gray backs have white (glossy) fronts. This is not quite as rare as I surmised three years ago (1 in 9), but still not common by any means. As a final note, I have now seen, in hand or on scans, a white-front version of each of the 60 cards (except a yellow logo House-the 61st card!), including Reiser. I welcome any comments. Bill Last edited by flkersn; 03-24-2020 at 12:35 PM.
|
|
#31
03-24-2020, 02:27 PM
|
|||
|
|||
|
x
  Hi Bill Sorry, but I don't trust any data that suggests that the population of cards #'s 171 - 180 is equal to cards #131 - 170. As we know....on a typical 100-card sheet (any series) of 1952 Topps cards, 4 rows are Double-Printed and 2 rows are Single-Printed. Cards #171 - 180 and cards #181 - 190 were Short-Printed. This is true regardless of whether they were White-backs or Gray-backs. I have collected 1952 TOPPS cards and filled customers want-lists for them for 40 years, so I've had a lot experience with these gems. Especially with the Billy Martin card. Every Gray-back Billy Martin card I have had, has instantly "flown off" my table at BB card shows. In fact, many years ago, dealers were paying me on the average of $400 for this card (irrelevant of its condition). TED Z T206 Reference .
|
|
#32
03-24-2020, 02:52 PM
|
|||
|
|||
|
I don't believe our data are in conflict. I'm suggesting that, on average, there is 1 white front for every 6 gray fronts (1 in 7 total). If there are less of 171-190 (which I believe), there are less of BOTH gray front and white front versions.
Perhaps I misunderstood your comment. (I really do have too much time on my hands.) Bill Last edited by flkersn; 03-24-2020 at 03:22 PM.
|
|
#33
03-24-2020, 02:58 PM
|
||||
|
||||
|
Each series was printed across two 100 card half sheets to make a full 200 card press sheet. George Vrechek has theorized for Run #3 (card #s 131 to 190): 40 players were triple printed, 20 players were quadruple printed to get to 200, or 4:3 ratio on shortprints.
|
|
#34
03-24-2020, 08:19 PM
|
|||
|
|||
|
Quote:
I pieced together 4 scans of a 1st series partial (50-card) sheet to simulate a 200-card sheet....just like you noted. Back in the early 1980's, I vaguely recall seeing such a sheet of 1952 TOPPS cards at Bill Bossert's store in Swarthmore, PA. These TOPPS sheets were printed using 54-inch (or 55-inch) track width printing presses of that era. V---------------------------------------------------------------- 54-inch wide printing press ------------------------------------------------------------------V 
|
|
#36
03-25-2020, 09:45 AM
|
|||
|
|||
|
1st series sheets are no help, as they have 80 cards, and 3rd series has 60.
2nd series is promising, as "the last row" are the sps. That would account for 180-190 being sps. But then why are the 4th series (2 rows) 281-310 sps
__________________
"Trolling Ebay right now" © Always looking for signed 1952 topps as well as variations and errors
|
|
#38
03-25-2020, 12:41 PM
|
||||
|
||||
|
Great info, guys.
I love reading/seeing all the sheets and info.
__________________
52 Topps cards. https://www.flickr.com/photos/144160280@N05/ http://www.net54baseball.com/album.php?albumid=922
|
 |
|
|
 Similar Threads
|
||||
| Thread | Thread Starter | Forum | Replies | Last Post |
| Okay, Stat Geeks...Time Was When... | clydepepper | Watercooler Talk- ALL sports talk | 0 | 05-02-2017 04:37 AM |
| Gray Ghost mem lot #3 | GrayGhost | Baseball Memorabilia B/S/T | 0 | 03-01-2015 02:20 PM |
| Ted Gray 1955 | brimo | Postwar Baseball Cards Forum (Pre-1980) | 0 | 07-31-2013 08:34 PM |
| Gray-backed Batter Ups? | Chris-Counts | Net54baseball Vintage (WWII & Older) Baseball Cards & New Member Introductions | 9 | 10-15-2011 09:19 PM |
| Looking for cards of Sam Gray | Archive | Net54baseball Vintage (WWII & Older) Baseball Cards & New Member Introductions | 8 | 01-05-2009 09:03 AM |


 Linear Mode

